Aerodynamics of 3D Printed Controlled Surface Topography
High-fidelity wind tunnel analysis quantifying the critical impacts of micro-surface perturbations and leading-edge erosion on viscous airflow and drag coefficients.
Overview
Problem Definition
Aerodynamic performance of airfoils is profoundly governed by micro-scale surface imperfections. Over time, surfaces such as wings or turbine blades undergo degradation, accumulating roughness and leading-edge erosion. This cutting-edge experimental study sought to determine exactly how and when such imperfections trigger early boundary layer transition and separation, ultimately compromising aerodynamic efficiency.
Project Objectives
The primary objectives were twofold: first, to precisely synthesize and quantify controlled surface roughness profiles (from micrometer to millimeter scales) on 3D-printed NACA 4412 airfoils; and second, to conduct dynamic wind tunnel telemetry to correlate these topographical anomalies directly with real-world drag increases and lift reductions.
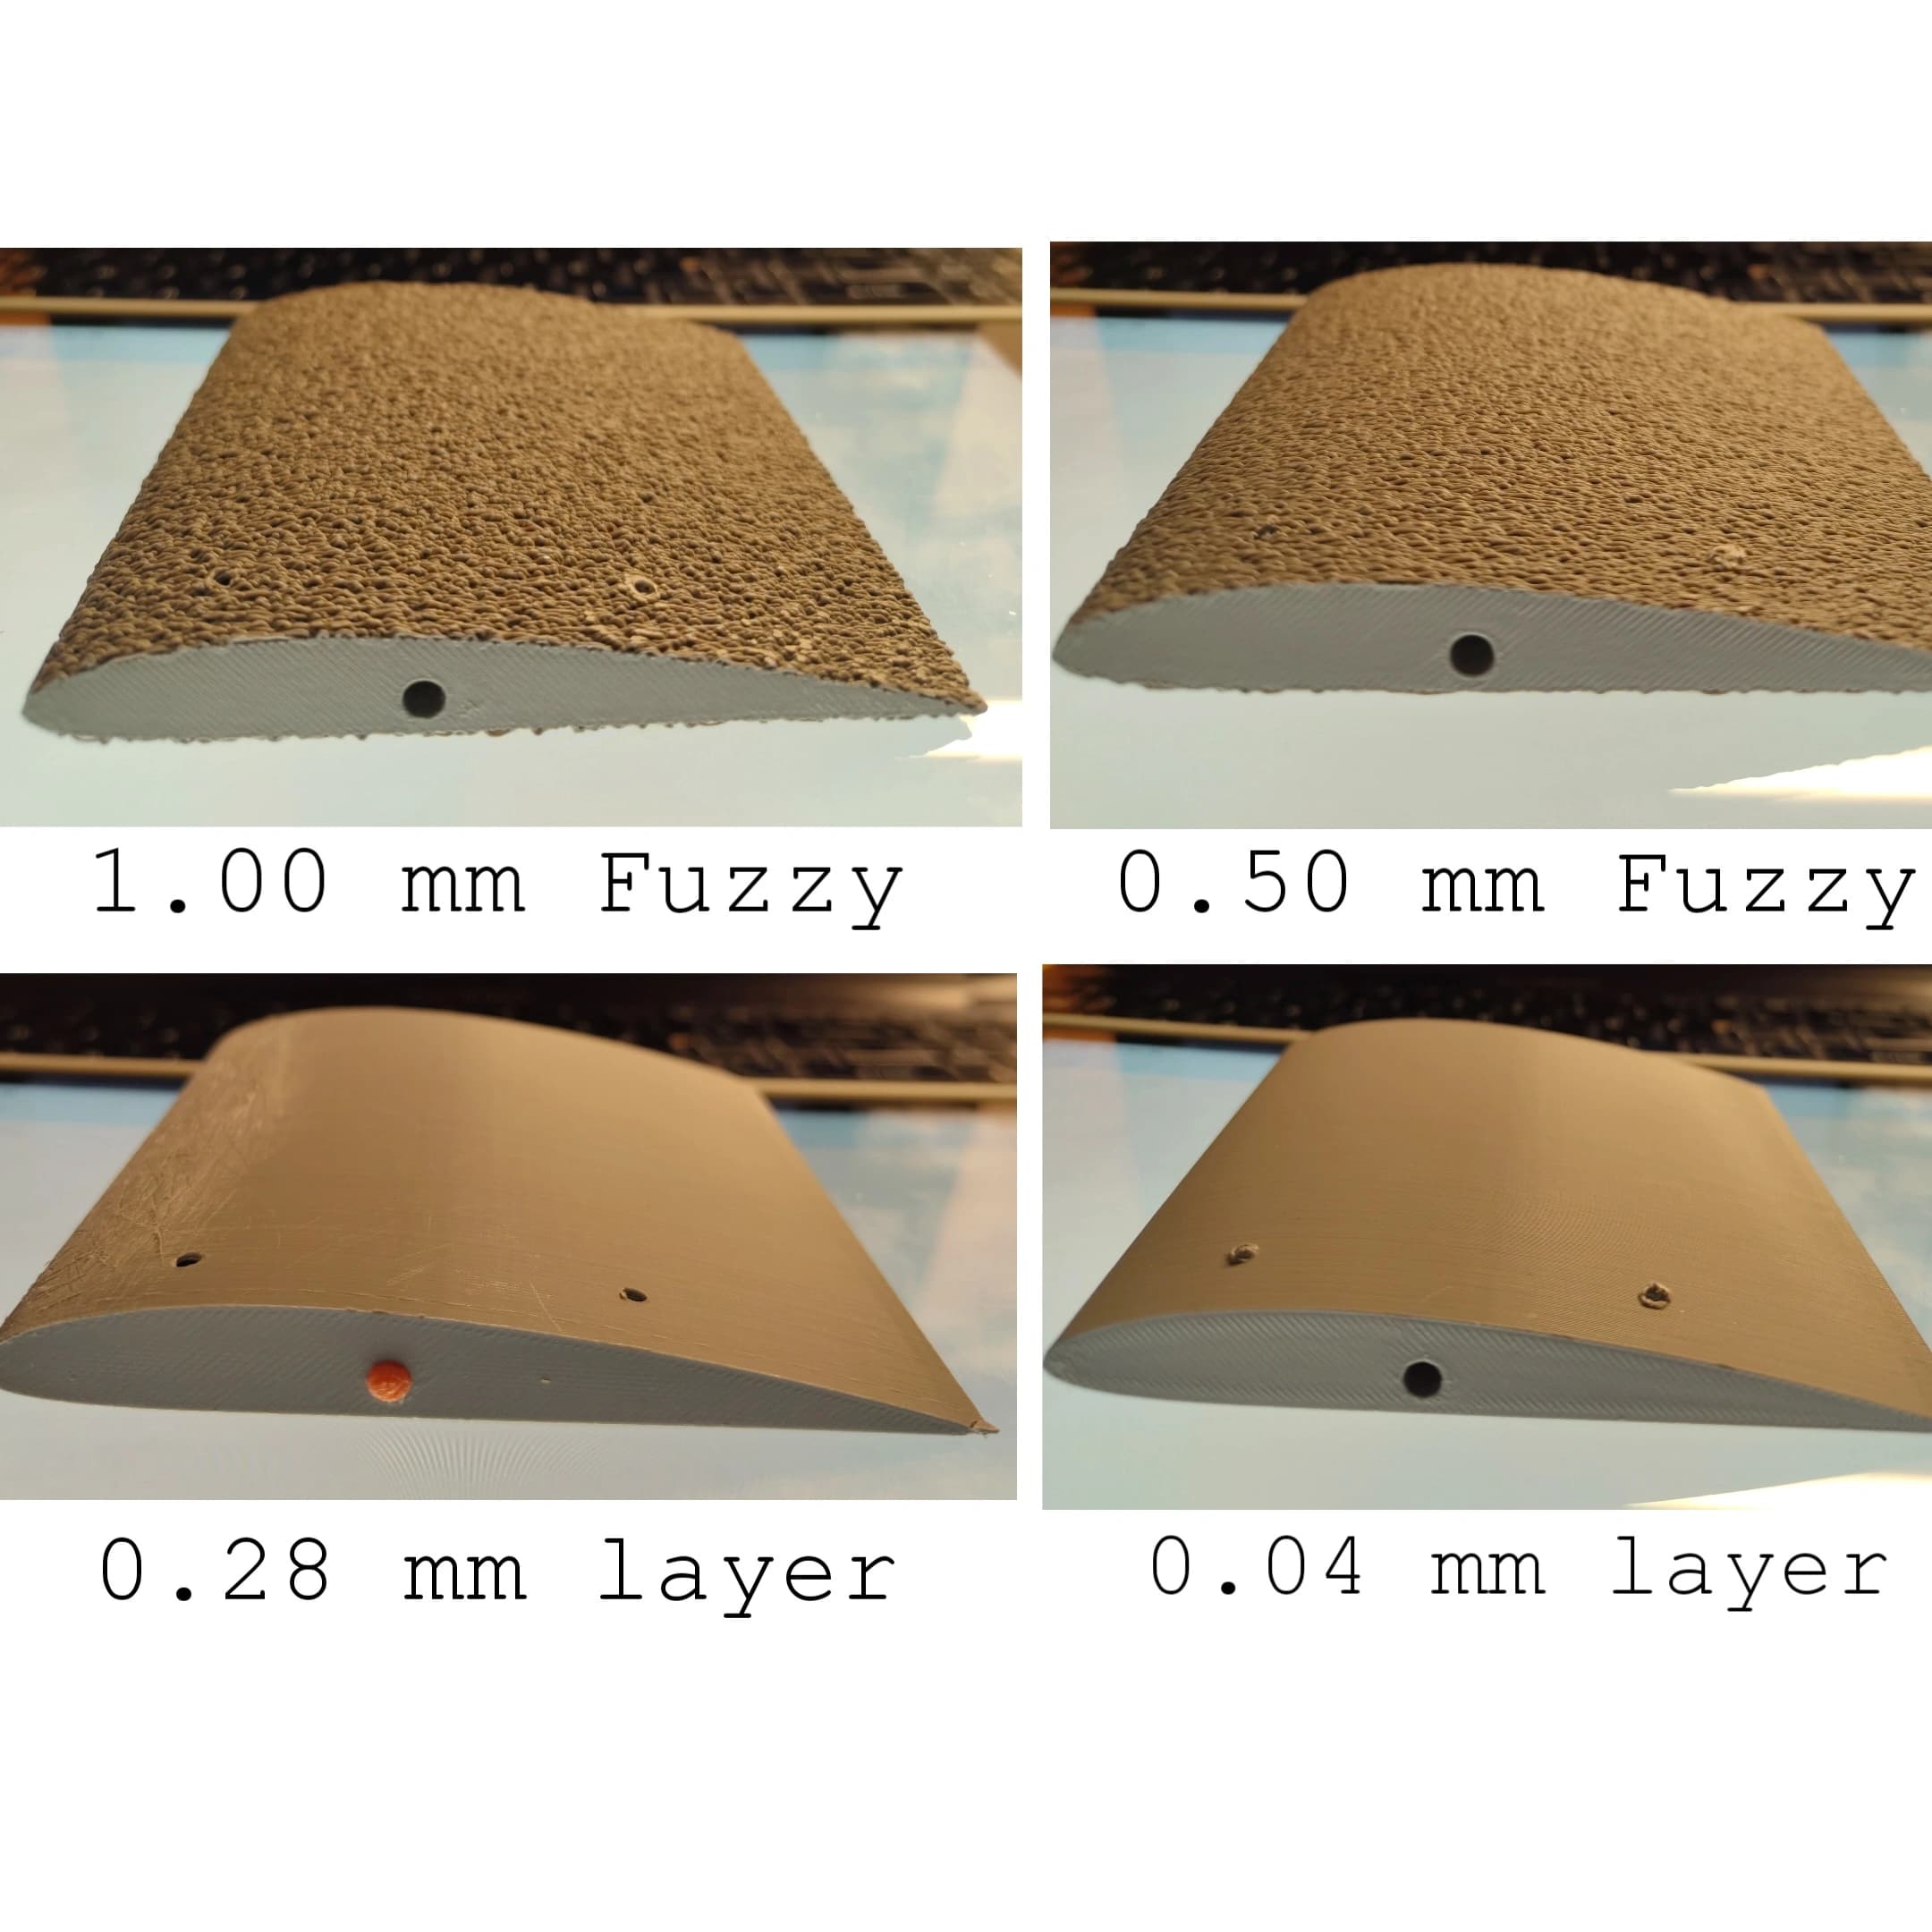
To execute this high-fidelity analysis, I led the mechanical synthesis of the test vehicle. We engineered and 3D-printed the NACA 4412 airfoil models via PLA, exploiting variable layer heights and algorithmic 'fuzzy skin' slicing parameters to achieve exact, micrometer-level controlled surface roughness states. The custom mounting superstructure was explicitly designed in CAD for flawless dynamic integration within the wind tunnel.
Four physical test models were manufactured to simulate diverse aerospace service conditions: a flawless baseline airfoil (0.04mm layer height), an aggressive leading-edge erosion model (simulated via 80-grit abrasion), and two algorithmically roughened models designed with exaggerated roughness topographies to ensure the aerodynamic boundary layer effects were distinctly measurable and calculable during wind tunnel testing.
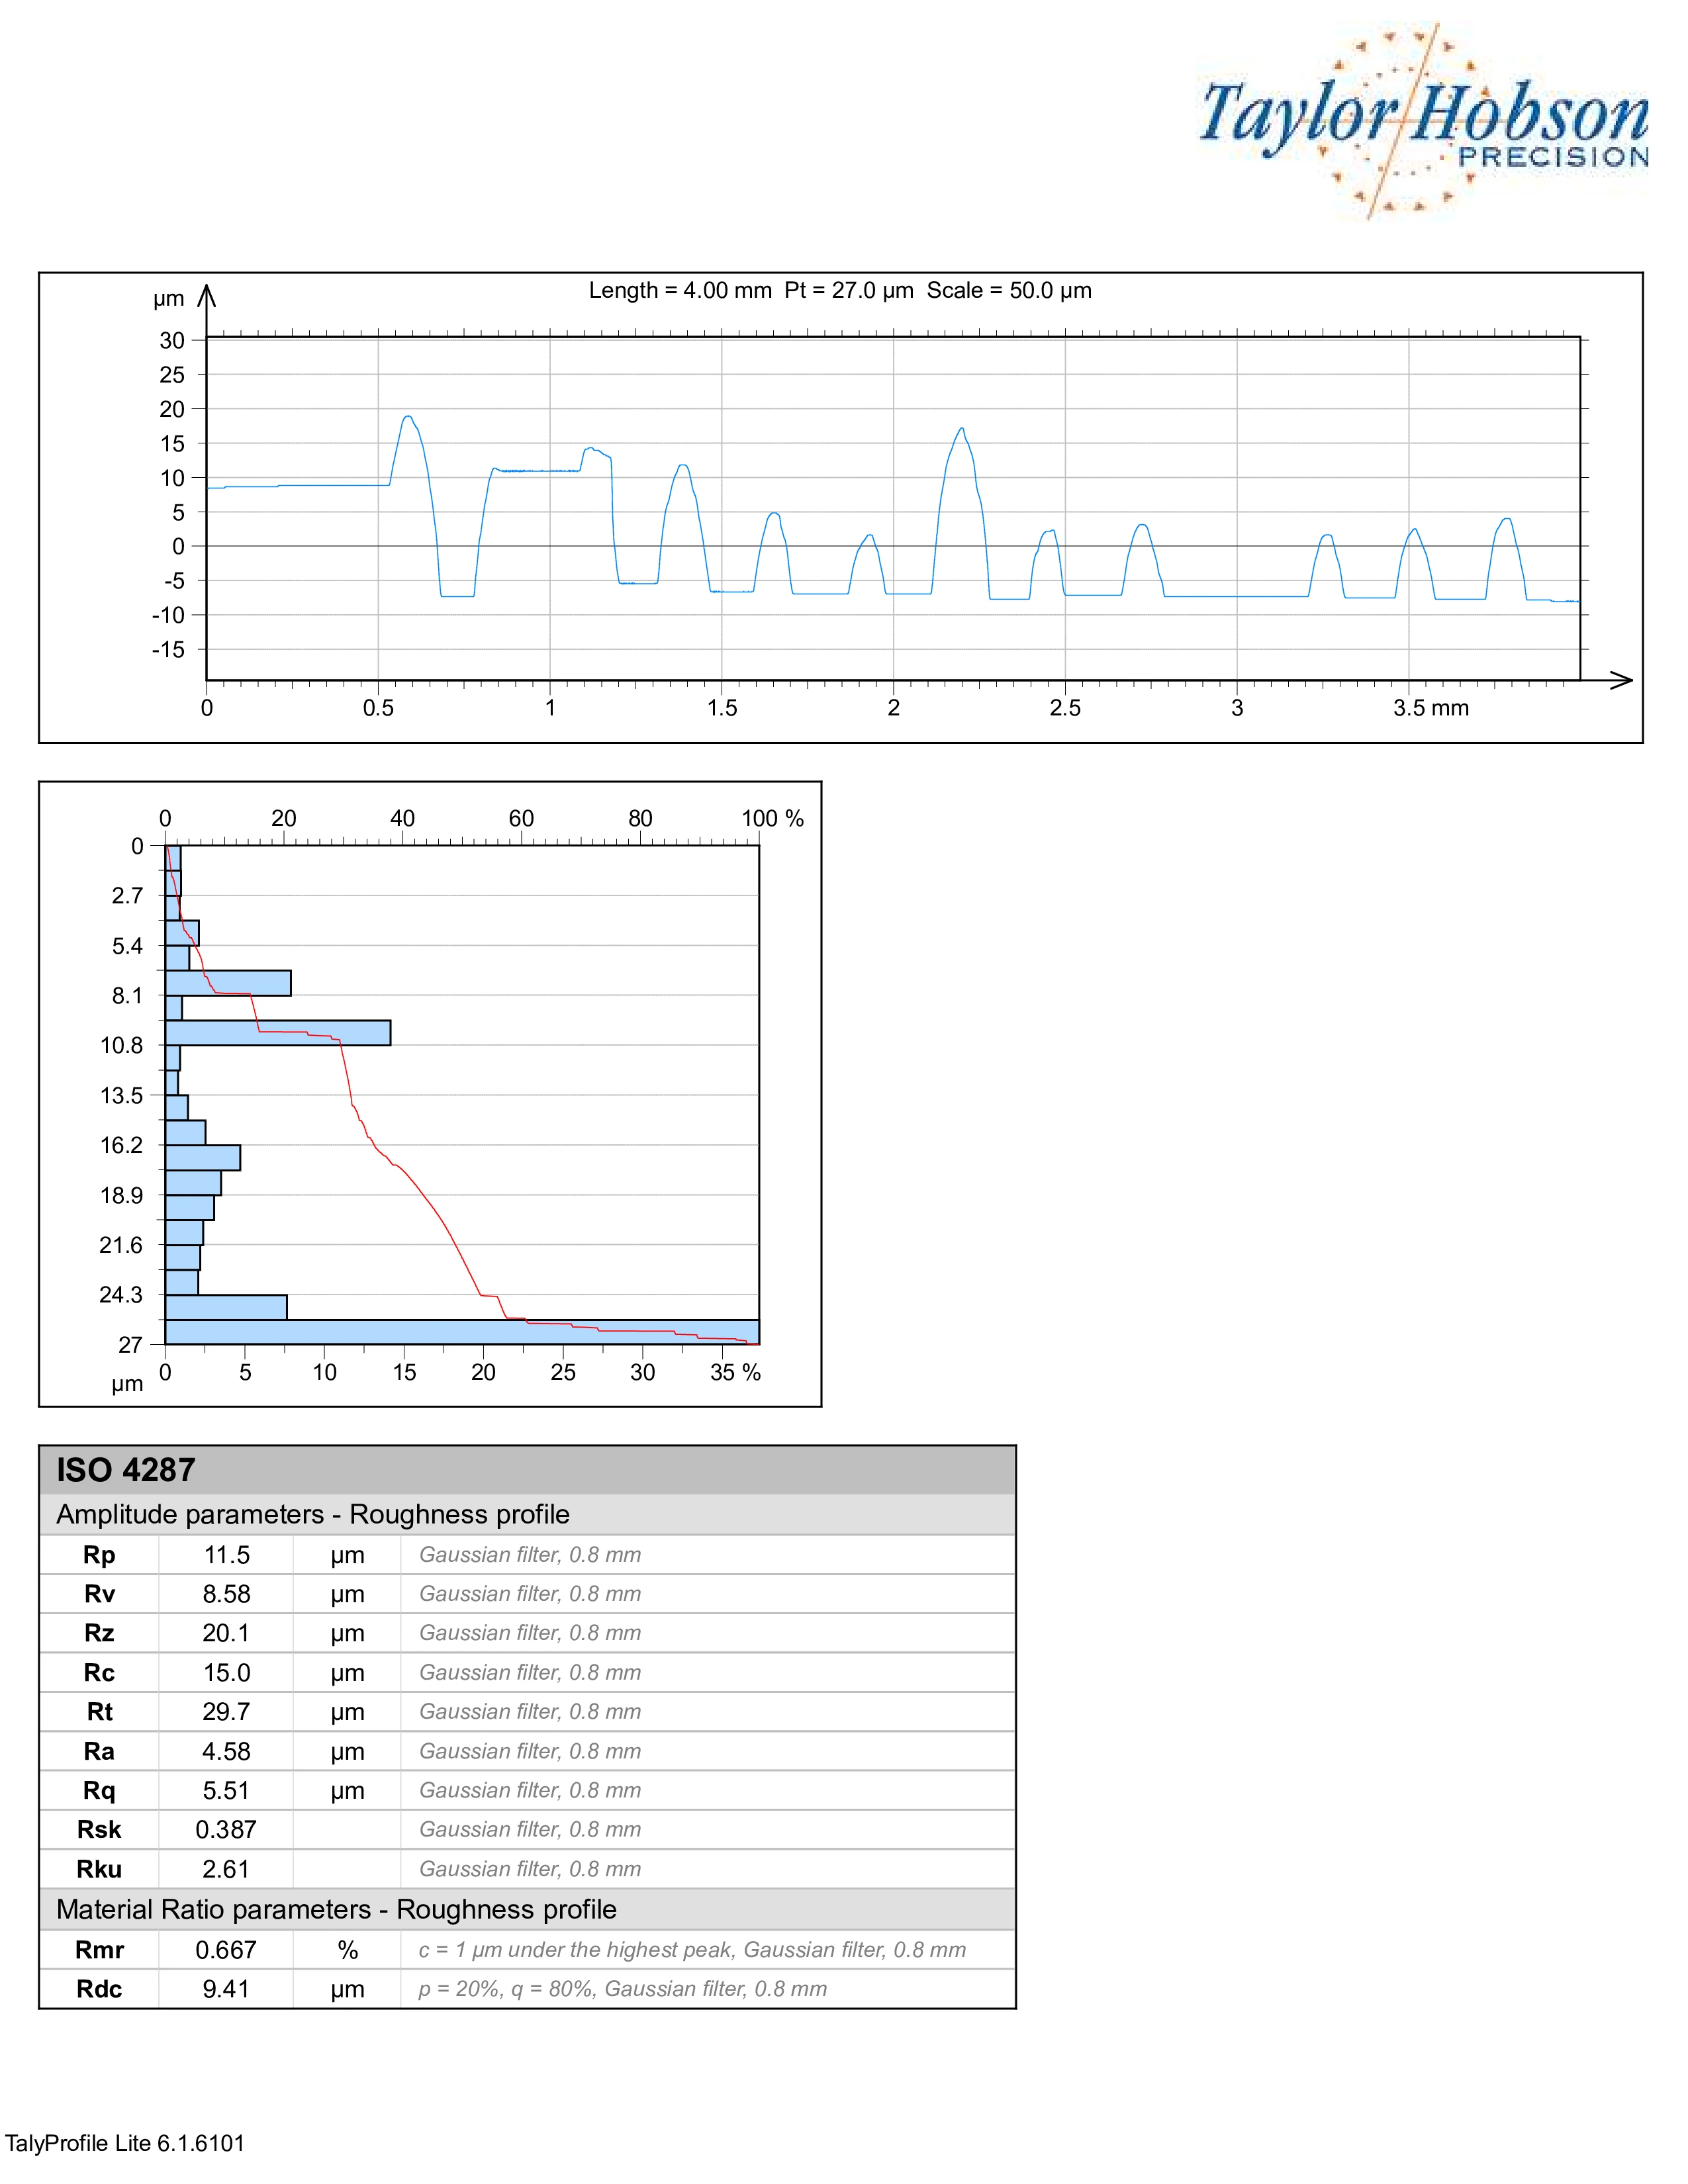
Prior to aerodynamic testing, we conducted rigorous surface metrology using a Taylor Hobson Surtronic 3+ stylus profilometer. We swept the airfoil chord with microscopic precision, establishing that the baseline model measured Ra = 3.66 µm, while the roughest model achieved millimeter-scale topography.
Experimental Results
Comprehensive dynamic testing within a high-speed wind tunnel captured continuous high-frequency lift and drag telemetry via an ultra-sensitive Linear Variable Differential Transformer (LVDT) force dynamometer. The results revealed a critical threshold: while micrometer-scale roughness produced nearly negligible aerodynamic effects, millimeter-scale roughness triggered dramatic boundary layer separation.
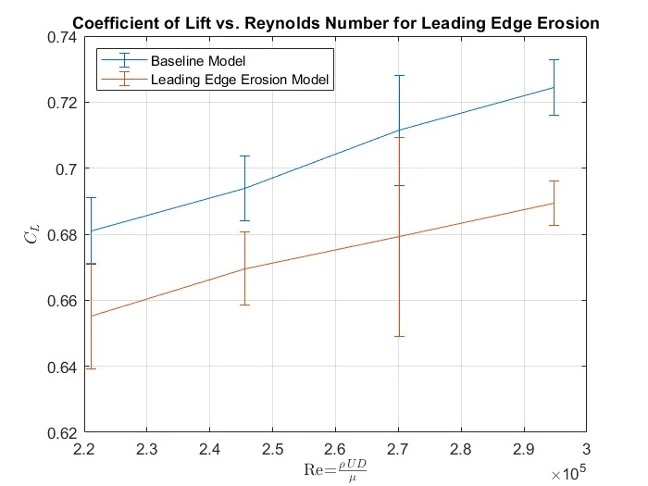
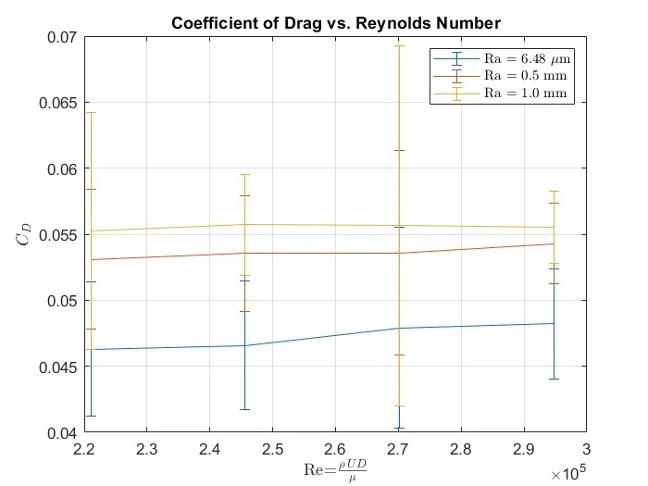
The 1.0mm roughness model suffered a massive drop in lift coefficient (down to 0.54-0.56 from the baseline's 0.68-0.72) and a corresponding spike in drag. Furthermore, the localized leading-edge erosion model demonstrated significant lift reduction despite the remainder of the airfoil being smooth. This conclusively validated that early boundary layer disturbances at the leading edge irreversibly degrade suction over the airfoil.
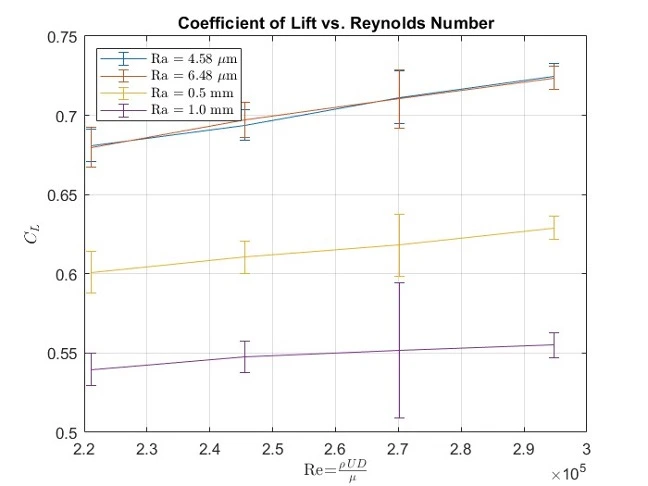
Higher surface roughness resulted in larger coefficients of drag for the airfoils, with notable diminishing returns as surface roughness increased. While the coefficient of lift experienced a slight increase with Reynolds number, the coefficient of drag remained fairly constant.
Discussion & Limitations
A primary limitation of the experiment was the narrow range of Reynolds numbers tested, constrained by the dimensions of the wind tunnel test section and the available velocity range. Because characteristic lengths and windspeeds could only be scaled within a single order of magnitude, the full extent of Reynolds number dependency was restricted. Future iterations could address this by utilizing a wind tunnel with a wider velocity range or a larger test area to accommodate larger characteristic lengths.
Additionally, precisely controlling and selecting surface roughness on 3D-printed PLA models posed a challenge, making it difficult to generate a continuous spectrum of roughness values. Future research could leverage alternative manufacturing techniques or easily machinable materials to establish more granular topographical states over a broader aerodynamic regime.
3D Model
Interactive 3D model of the NACA 4412 aerodynamic assembly — drag to orbit, scroll to zoom.
Technical Drawings
Final Build
Process
01 — Metrology & Mechanical Synthesis
Precision Manufacturing and Topographical Scanning
Engineered airfoils with exacting algorithmic roughness profiles via additive manufacturing. Validated the structural anomalies using micrometer-level stylus profilometry to guarantee sub-millimeter surface accuracy and generate a reliable topographical baseline.
02 — Experimental Integration
Dynamometer Calibration & Wind Tunnel Setup
Calibrated the highly sensitive LVDT force dynamometer and seamlessly integrated the CAD-designed mounting chassis within the high-speed wind tunnel test section, establishing strict environmental and alignment controls.
03 — Dynamic Telemetry Acquisition
High-Velocity Airflow Analysis
Subjected the models to intense simulated flight conditions. Utilized MATLAB-driven data acquisition systems to stream continuous, high-fidelity lift and drag matrices across multiple velocity vectors, isolating the catastrophic aerodynamic effects of boundary layer degradation.
Engineering Details
Aerodynamic Test Model Parameters
| Geometric Parameter | Specification |
|---|---|
| Airfoil Profile | NACA 4412 |
| Chord Length | 100 mm |
| Span Length | 100 mm |
| Maximum Camber | 4 mm |
| Camber Location | 40 mm |
| Maximum Thickness | 12 mm |
| Reference Area | 0.01 m² |
| Angle of Attack | 10º (Fixed incidence) |
Experimental Matrices
| Case Reference | Model Topography |
|---|---|
| Base Control | Mounting Holder Only (Aerodynamic zeroing) |
| Baseline | Flawless Smooth Airfoil |
| Degradation Model A | Aggressive Leading Edge Erosion |
| Degradation Model B | Controlled 0.5mm Micro-Roughness |
| Degradation Model C | Controlled 1.0mm Macro-Roughness |
More projects
View all
PDR Complete
ORPHEUS — Venus Aerobot Mission
A NASA Discovery-class mission concept deploying an autonomous Aerobot into Venus's cloud layer to study surface–atmosphere interactions at Artemis Corona.

Research Project Complete
Higgs Boson Signal Classification
Trained a PyTorch deep neural network (DNN) to separate Higgs boson signals (H → ZZ → 4ℓ) from background processes using CMS Open Data, achieving 97.1% validation accuracy.